Exhibit 10.2
The following questions are based on the problem description and the output below.
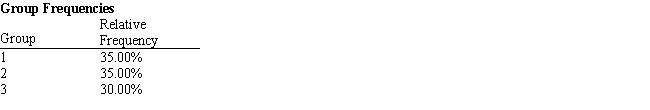
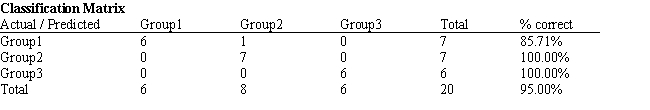
A college admissions officer wants to evaluate graduate school applicants based on their GMAT scores, verbal and quantitative. Students are classified as either successful (Group 1) , marginally successful (Group 2) or not-successful (Group 3) in their graduate studies. The officer has data on 20 current students, 7 successful (Group 1) , 6 marginally successful (Group 2) and 7 not successful (Group 3) . 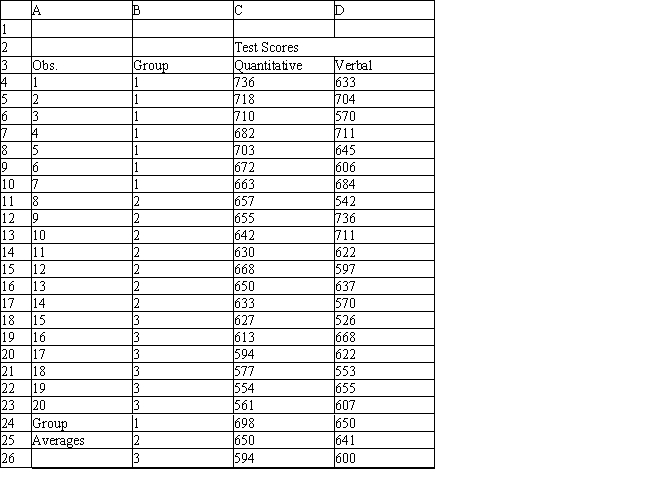
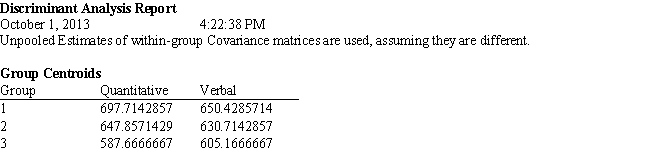
-Refer to Exhibit 10.2. What is the quantitative test score value of the group centroid for group 1?
A) 697.71
B) 647.86
C) 587.67
D) 650.43
Correct Answer:
Verified
Q5: A classification tree is a graphical representation
Q6: Affinity analysis is a data mining technique
Q7: Suppose that an analyst classified a new
Q8: Data mining is the process of finding
Q9: The Fisher classification scores can be converted
Q11: Exhibit 10.2
The following questions are based on
Q12: Exhibit 10.2
The following questions are based on
Q13: Exhibit 10.2
The following questions are based on
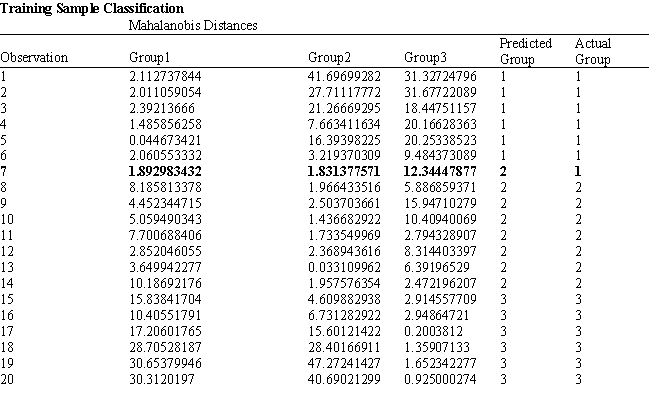
Q14: The Mahalanobis distance measure accounts for differences
Q15: If using the regression tool for two-group
Unlock this Answer For Free Now!
View this answer and more for free by performing one of the following actions

Scan the QR code to install the App and get 2 free unlocks

Unlock quizzes for free by uploading documents