Exhibit 10.1
The following questions are based on the problem description and the output below.
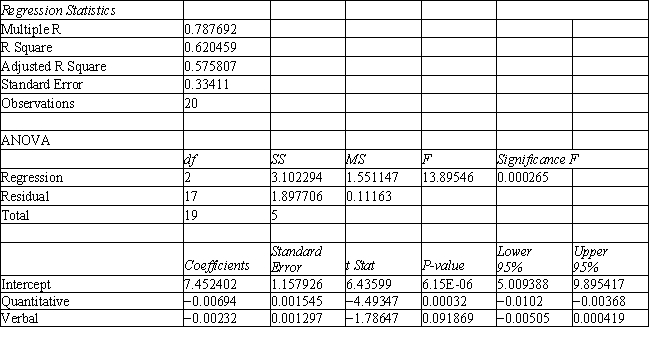
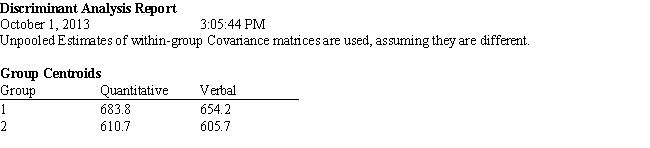
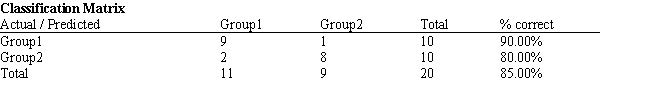
A college admissions officer wants to evaluate graduate school applicants based on their GMAT scores, verbal and quantitative. Students are classified as either successful or not-successful in their graduate studies. The officer has data on 20 current students, ten of whom are doing very well (Group 1) and ten who are not (Group 2) . 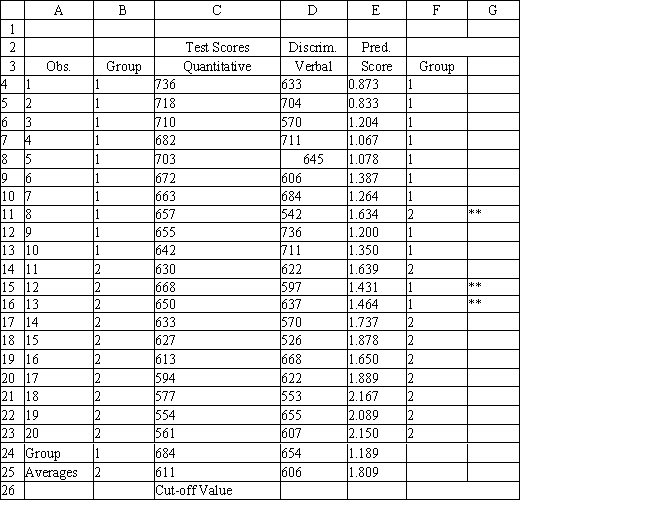
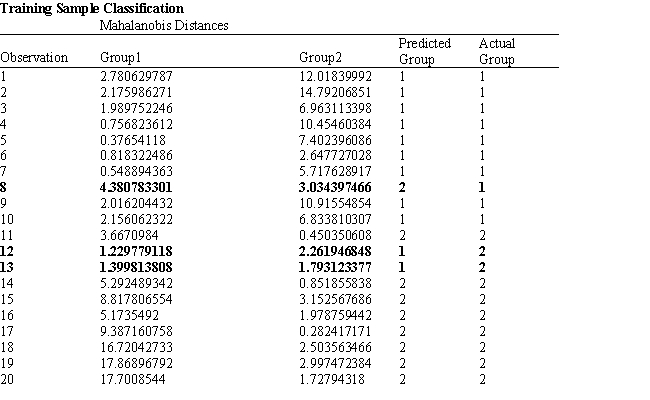
-Refer to Exhibit 10.1. The straight line distance between two points (X1, Y1) and (X2, Y2) is calculated as
A) X1 − Y1 + X2 − Y2
B) (X1 − X2) 2 + (Y1 − Y2) 2
C) 
D) 
Correct Answer:
Verified
Q102: Exhibit 10.3
The information below is used for
Q103: Exhibit 10.4
The information below is used for
Q104: Normalization of data involves
A) expressing each variable
Q105: An Excel add-in tool used for data
Q106: Exhibit 10.1
The following questions are based on
Q108: Oversampling forces a classification method to
A) discriminate
Q109: In classification techniques the dependent variable is
A)
Q110: A test sample is often used to
Q111: Exhibit 10.6
The information below is used for
Q112: The regression approach can be used in
Unlock this Answer For Free Now!
View this answer and more for free by performing one of the following actions

Scan the QR code to install the App and get 2 free unlocks

Unlock quizzes for free by uploading documents