Exhibit 11.11
The following questions use the data below.
Joe's Sporting Goods wants to forecast quarterly sales figures using seasonal indices. The store has collected 12 quarters of data and needs your help to analyze the data. The relevant regression output is in the following table. 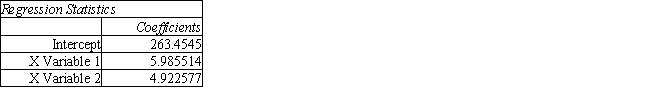
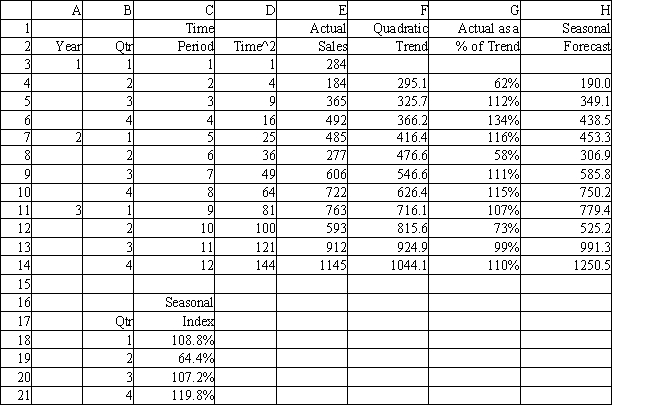
-Refer to Exhibit 11.11. What formula should be entered in cell C18 to compute the Seasonal Index value for quarter 1?
A) =SUM($B$3:$B$14) /COUNTIF($B$3:$B$14,B18)
B) =SUMIF($B$3:$B$14,B18,$G$3:$G$14) /COUNTIF($B$3:$B$14,B18)
C) =SUMIF($B$3:$B$14,$G$3:$G$14) /COUNT($B$3:$B$14,B18)
D) =SUMIF($B$3:$B$14,B18) /COUNTIF($B$3:$B$14,B18)
Correct Answer:
Verified
Q12: The TREND( ) function can be used
Q13: Exhibit 11.1
The following questions use the data
Q14: Exhibit 11.8
The following questions use the data
Q15: The determination of the MSE-minimizing value of
Q16: Exhibit 11.12
The following questions use the data
Q18: Exhibit 11.2
The following questions use the data
Q19: In stationary time series there is no
Q20: Exhibit 11.7
The following questions use the data
Q21: Exhibit 11.8
The following questions use the data
Q22: Seasonality in a time series is indicated
Unlock this Answer For Free Now!
View this answer and more for free by performing one of the following actions

Scan the QR code to install the App and get 2 free unlocks

Unlock quizzes for free by uploading documents