Exhibit 13.4
The following questions refer to the information and output below.
A grocery store can serve an average of 360 customers per hour. The service times are exponentially distributed. The store has 4 checkout lines each of which serves 90 customers per hour. Customers arrive at the store at a Poisson rate of 240 customers per hour. The following queuing analysis spreadsheet was developed from this information. 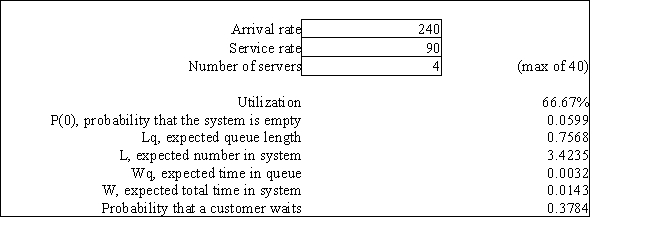
-Refer to Exhibit 13.4. Based on this report what percent of the time is a grocery clerk busy serving a customer?
Correct Answer:
Verified
Q64: Exhibit 13.3
The following questions refer to the
Q65: Exhibit 13.5
The following questions refer to the
Q66: Exhibit 13.4
The following questions refer to the
Q67: A company has recorded the following list
Q68: Exhibit 13.7
The following questions refer to the
Q70: Exhibit 13.1
The following questions are based on
Q71: Exhibit 13.2
The following questions refer to the
Q72: The customer service desk at Joe's Discount
Q73: A grocery clerk can serve 20 customers
Q74: Exhibit 13.6
The following questions refer to the
Unlock this Answer For Free Now!
View this answer and more for free by performing one of the following actions

Scan the QR code to install the App and get 2 free unlocks

Unlock quizzes for free by uploading documents