What principle does this graph depict?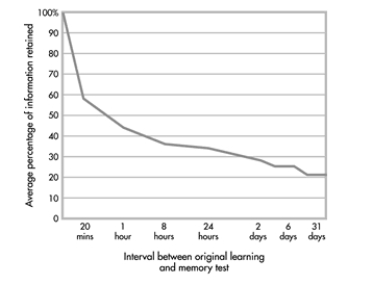
A) the Sperling decay of sensory memory curve
B) Baddeley's working memory curve
C) Kandel's long-term potentiation curve
D) the Ebbinghaus forgetting curve
Correct Answer:
Verified
Q369: Why were nonsense syllables used in the
Q370: Hermann Ebbinghaus:
A) was both the experimenter and
Q371: The graphic representation of the results of
Q372: According to Ebbinghaus's research:
A) encoding failure is
Q373: Which is the best explanation for encoding
Q375: The inability to recall information that was
Q376: How are flashbulb memories different from ordinary
Q377: Mike began studying for his exam the
Q378: On a visit to his mother's home,
Q379: Identify the psychologist credited with originating the
Unlock this Answer For Free Now!
View this answer and more for free by performing one of the following actions

Scan the QR code to install the App and get 2 free unlocks

Unlock quizzes for free by uploading documents