This graph shows the changing electrical charge of a neuron when it activates. Of the choices given, which correctly labels the different phases depicted in the graph?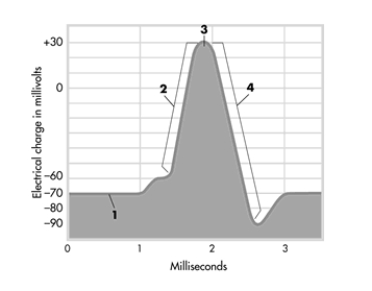
A) 1 = action potential, 2 = stimulus threshold, 3 = refractory period, 4 = resting potential
B) 1 = ions cross membrane, 2 = action potential, 3 = stimulus threshold, 4 = depolarization
C) 1 = depolarization, 2 = action potential, 3 = stimulus threshold, 4 = repolarization
D) 1 = resting potential, 2 = ions cross membrane, 3 = action potential, 4 = refractory period
Correct Answer:
Verified
Q303: Which two factors affect the speed at
Q304: The most common form of communication between
Q305: Which of the following is the sequence
Q306: Presynaptic neuron is to postsynaptic neuron as:
A)
Q307: What is the result of sodium ions
Q309: Which of the following best defines a
Q310: The action potential is produced by the:
A)
Q311: The presynaptic neuron and the postsynaptic neuron
Q312: The fastest neurons in the human body
Q313: Communication between two neurons occurs at the:
A)
Unlock this Answer For Free Now!
View this answer and more for free by performing one of the following actions

Scan the QR code to install the App and get 2 free unlocks

Unlock quizzes for free by uploading documents