The following graph is _______________. 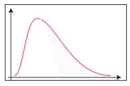
A) Positively skewed
B) Negatively skewed
C) Symmetric
D) Uniformly distributed
Correct Answer:
Verified
Q22: To locate the percentile for a given
Q37: The test scores for a class of
Q46: What is the value of the Pearson
Q49: The following graph illustrates _. 
Q56: In a contingency table, we describe the
Q58: What is the possible range of values
Q59: A large oil company is studying the
Q64: A _ uses dots to show frequencies.
Q69: In a symmetric distribution, is the 99th
Q71: If the mean of a distribution is
Unlock this Answer For Free Now!
View this answer and more for free by performing one of the following actions

Scan the QR code to install the App and get 2 free unlocks

Unlock quizzes for free by uploading documents