The following graph is a ___________. 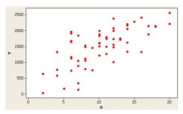
A) Dot plot
B) Stem-and-leaf display
C) Box plot
D) Scatter plot
Correct Answer:
Verified
Q51: A sample of experienced typists revealed that
Q54: A contingency table would be used to
Q58: The range of the coefficient of skewness
Q62: In a negatively skewed distribution, the coefficient
Q63: A _ shows the interquartile range.
Q66: The interquartile range is the distance between
Q67: A _ clearly shows outliers.
Q78: A _ is the best way to
Q79: In a positively skewed distribution, the 50th
Q80: The coefficient of skewness measures a distribution's
Unlock this Answer For Free Now!
View this answer and more for free by performing one of the following actions

Scan the QR code to install the App and get 2 free unlocks

Unlock quizzes for free by uploading documents