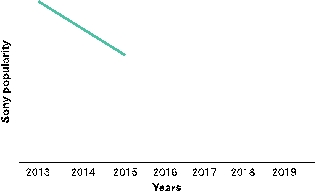
The following is a graph showing a decline in the popularity of Sony laptop computers between the years 2013 and 2015.Complete the graph by drawing two lines: one line corresponds to what a dialectical person would predict will happen between 2016 and 2019,and one line corresponds to what a nondialectical person would predict will happen between 2016 and 2019.
Correct Answer:
Verified
View Answer
Unlock this answer now
Get Access to more Verified Answers free of charge
Q19: Which of the following most accurately portrays
Q20: You are walking with your friend when
Q21: A researcher asks a participant to organize
Q22: Generate a set of three items,such that
Q23: A cognitive psychologist is teaching a course
Q25: Recent fieldwork suggests that the Saami people
Q25: Color terms from different cultures around the
Q26: Your roommate is from a high context
Q27: People from cultures that do not have
Q44: Eric and Andy are sitting on a
Unlock this Answer For Free Now!
View this answer and more for free by performing one of the following actions

Scan the QR code to install the App and get 2 free unlocks

Unlock quizzes for free by uploading documents