Multiple Choice
Table 7-7

-Refer to Table 7-7. You are selling extra tickets to the Midwest Regional Sweet 16 game in the men's NCAA basketball tournament. The table shows the willingness to pay of the four potential buyers in the market for a ticket to the game. Which of the following graphs represents the market demand curve?
A) 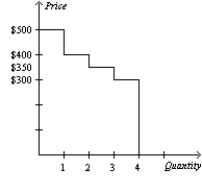
B) 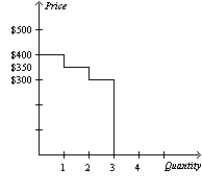
C) 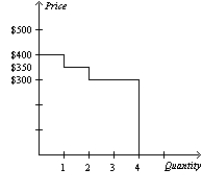
D) 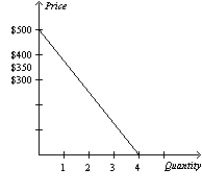
Correct Answer:
Verified
Related Questions
Q23: A drought in California destroys many red
Q24: Bob purchases a book for $6,and his
Q69: Table 7-9
During the last two days, Chad
Q70: Table 7-10
The only four consumers in a
Q74: Table 7-9
During the last two days, Chad
Q369: Table 7-3
The only four consumers in a
Q383: Table 7-6
For each of three potential buyers

