Essay
Use the following graph shown to fill in the table that follows. 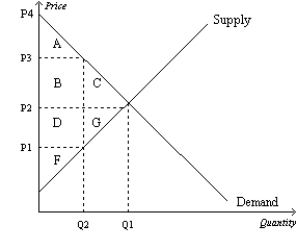

Correct Answer:
Verified
Related Questions
Q8: Figure 8-25 Q10: Figure 8-25 Q17: Figure 8-25 Q42: As the size of a tax increases, Q44: Economists dismiss the idea that lower tax Q47: Tax revenues increase in direct proportion to Q53: Suppose that a university charges students a Q59: The optimal tax is difficult to determine Q118: John has been in the habit of Q457: Suppose that instead of a supply-demand diagram, Unlock this Answer For Free Now! View this answer and more for free by performing one of the following actions Scan the QR code to install the App and get 2 free unlocks Unlock quizzes for free by uploading documents![]()
![]()
![]()

