Figure 10-12 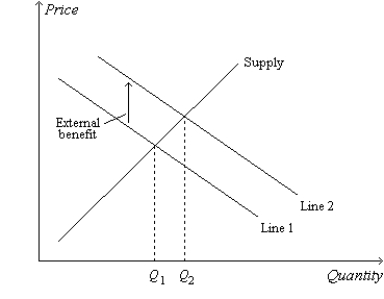
-Refer to Figure 10-12. Suppose, on the figure, Q represents the quantity of education and P represents the price of education. Then the quantity  represents
A) an inefficiency.
B) the extent of the negative externality that pertains to the market for education.
C) the amount of the tax that would be required to correct the negative externality that pertains to the market for education.
D) the amount of the subsidy that would be required to correct the positive externality that pertains to the market for education.
Correct Answer:
Verified
Q166: Scenario 10-1
The demand curve for gasoline slopes
Q206: Figure 10-12 Q422: If the social value of producing a Q428: Assuming education results in a positive externality, Q430: Figure 10-12 Q431: Figure 10-12 Q434: Figure 10-12 Q435: Scenario 10-1 Q439: Figure 10-12 Q440: Figure 10-12 Unlock this Answer For Free Now! View this answer and more for free by performing one of the following actions Scan the QR code to install the App and get 2 free unlocks Unlock quizzes for free by uploading documents![]()
![]()
![]()
![]()
The demand curve for gasoline slopes![]()
![]()

