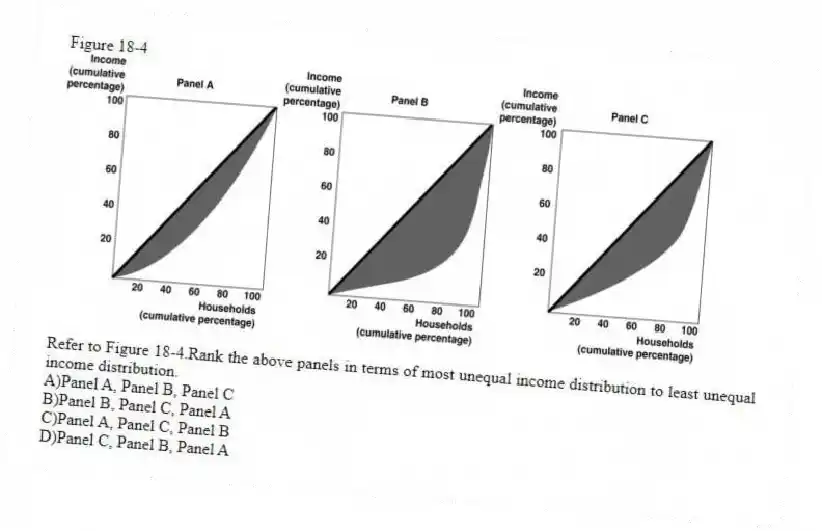
Figure 18-4
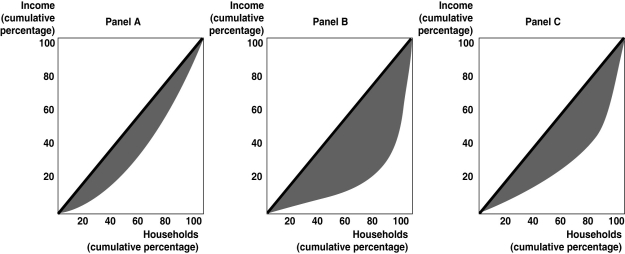
-Refer to Figure 18-4.Rank the above panels in terms of most unequal income distribution to least unequal income distribution.
A) Panel A, Panel B, Panel C
B) Panel B, Panel C, Panel A
C) Panel A, Panel C, Panel B
D) Panel C, Panel B, Panel A
Correct Answer:
Verified
Q201: During the past 30 years, income inequality
Q202: For the top 1 percent of income
Q203: Figure 18-5 Q204: Figure 18-6 Q205: The Gini coefficient is measured by Q207: Figure 18-6 Q208: Article Summary Q209: As the value of the Gini coefficient Q210: Figure 18-3 Q211: As the value of the Gini coefficient Unlock this Answer For Free Now! View this answer and more for free by performing one of the following actions Scan the QR code to install the App and get 2 free unlocks Unlock quizzes for free by uploading documents
![]()
![]()
A)summing up
![]()
State tax revenue from marijuana sales
![]()

