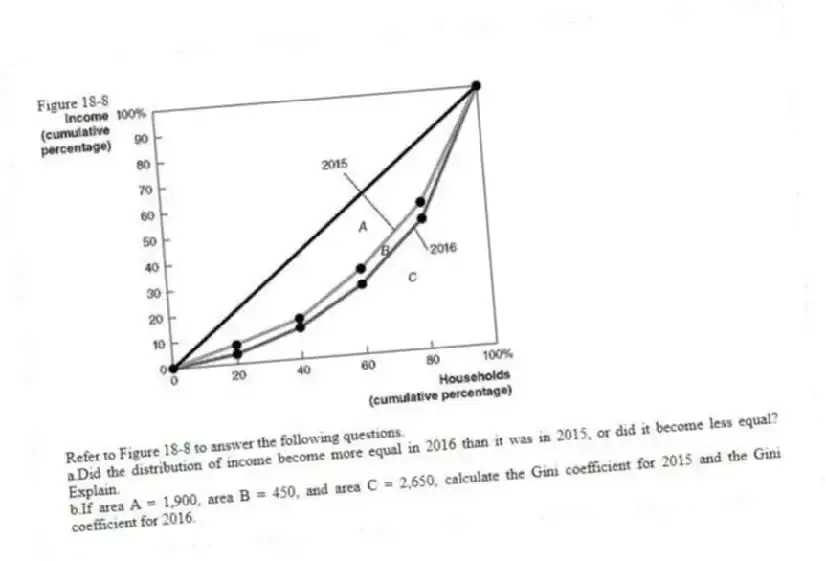
Figure 18-8
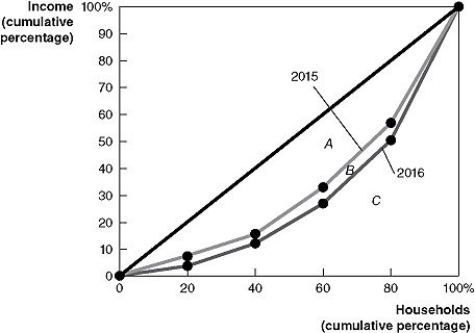
-Refer to Figure 18-8 to answer the following questions.
a.Did the distribution of income become more equal in 2016 than it was in 2015, or did it become less equal? Explain.
b.If area A = 1,900, area B = 450, and area C = 2,650, calculate the Gini coefficient for 2015 and the Gini coefficient for 2016.
Correct Answer:
Verified
View Answer
Unlock this answer now
Get Access to more Verified Answers free of charge
Q248: Economists caution that conventional statistics used to
Q249: Between 1970 and 2010, the poverty rate
Q250: From 1970 to 2010, the poverty rate
Q251: Which of the following statements is true?
A)If
Q252: What is the difference between the poverty
Q253: If the Gini coefficient for Cartland is
Q254: Compare the distribution of income in the
Q255: Income inequality increases as the Gini coefficient
Q256: Table 18-11 Q258: Describe the main factors economists believe cause
![]()
Unlock this Answer For Free Now!
View this answer and more for free by performing one of the following actions

Scan the QR code to install the App and get 2 free unlocks

Unlock quizzes for free by uploading documents