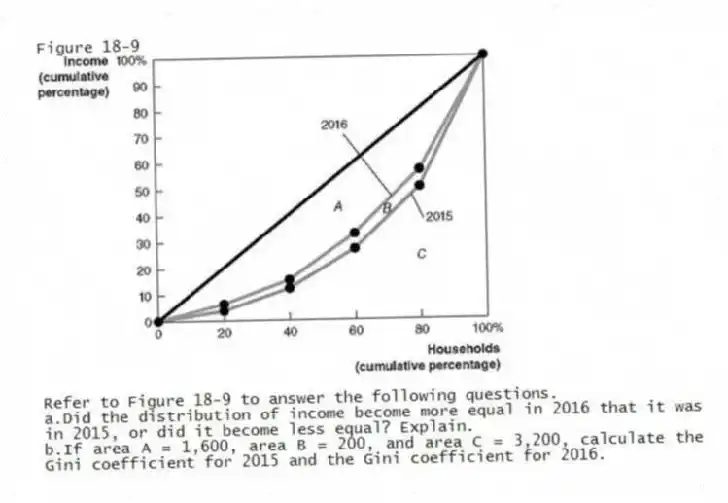
Figure 18-9
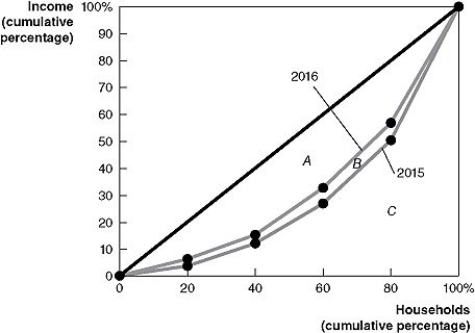
-Refer to Figure 18-9 to answer the following questions.
a.Did the distribution of income become more equal in 2016 that it was in 2015, or did it become less equal? Explain.
b.If area A = 1,600, area B = 200, and area C = 3,200, calculate the Gini coefficient for 2015 and the Gini coefficient for 2016.
Correct Answer:
Verified
View Answer
Unlock this answer now
Get Access to more Verified Answers free of charge
Q241: Rapid economic growth tends to increase the
Q242: A Lorenz curve summarizes the information provided
Q243: Table 18-12 Q244: What is a Lorenz curve and what Q245: Holding all other factors constant, income earned Q247: The federal government does not tax employees Q248: Economists caution that conventional statistics used to Q249: Between 1970 and 2010, the poverty rate Q250: From 1970 to 2010, the poverty rate Q251: Which of the following statements is true?
![]()
A)If
Unlock this Answer For Free Now!
View this answer and more for free by performing one of the following actions

Scan the QR code to install the App and get 2 free unlocks

Unlock quizzes for free by uploading documents