
Figure 11-11
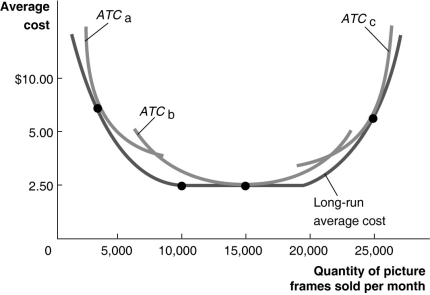
Figure 11-11 illustrates the long-run average cost curve for a firm that produces picture frames. The graph also includes short-run average cost curves for three firm sizes: ATCₐ, ATCb and ATCc.
-Refer to Figure 11-11.Constant returns to scale
A) occur for output rates greater than 5,000 picture frames.
B) occur between 5,000 and 20,000 picture frames per month.
C) occur between 10,000 and 20,000 pictures frames per month.
D) will shift the long-run average cost curve downward.
Correct Answer:
Verified
Q254: If an airport decides to expand by
Q255: Which of the following statements explains the
Q256: Which of the following is not a
Q257: If an airport decides to expand by
Q258: The level of output at which all
Q260: Figure 11-11 Q261: An important reason why diseconomies of scale Q262: An isocost line shows Q263: Table 11-9 Q264: The slope of an isoquant measures
![]()
A)all the possible combinations
![]()
A)the price
Unlock this Answer For Free Now!
View this answer and more for free by performing one of the following actions

Scan the QR code to install the App and get 2 free unlocks

Unlock quizzes for free by uploading documents