
Figure 10-2
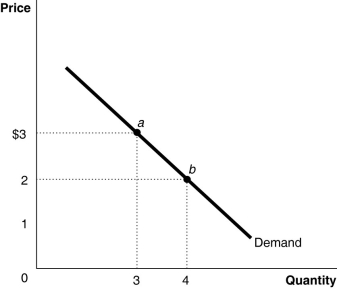
Figure 10-2 represents the demand for ice cream cones.
-Refer to Figure 10-2.Which of the following statements is true?
A) Points a and b are the utility-maximizing quantities of ice cream cones at two different prices of ice cream.
B) Points a and b may not necessarily be the utility-maximizing quantities of ice cream cones at two different prices because we have no information on the consumer's budget or the price of other goods.
C) Point a could be a utility-maximizing choice if the price is $3 but point b may not be because we have no information on the marginal utility per dollar when price changes.
D) Points a and b are derived independently of the utility-maximizing model.
Correct Answer:
Verified
Q117: Figure 10-1 Q118: Lilly Davis has $5 per week to Q119: Arnie Ziffel has $20 per week to Q120: If by purchasing more apples and fewer Q121: What is a Giffen good? Q123: The demand curve for an inferior good Q124: Along a downward-sloping linear demand curve Q125: The demand curve for a luxury good Q126: The demand curve for a Giffen good Q127: Each price-quantity combination on a consumer's demand
![]()
A)the marginal
Unlock this Answer For Free Now!
View this answer and more for free by performing one of the following actions

Scan the QR code to install the App and get 2 free unlocks

Unlock quizzes for free by uploading documents