
Figure 10-2
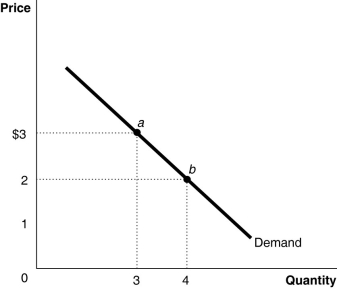
Figure 10-2 represents the demand for ice cream cones.
-Refer to Figure 10-2.When the price of ice cream cones increases from $2 to $3, quantity demanded decreases from 4 ice cream cones to 3 ice cream cones.This change in quantity demanded is due to
A) the price and output effects.
B) the income and substitution effects.
C) the law of diminishing marginal utility.
D) the fact that marginal willingness to pay falls.
Correct Answer:
Verified
Q125: The demand curve for a luxury good
Q126: The demand curve for a Giffen good
Q127: Each price-quantity combination on a consumer's demand
Q128: The only Giffen goods that have been
Q129: Giffen goods
A)are theoretical and have never been
Q131: What must be true in terms of
Q132: We can derive the market demand curve
Q133: The demand curve for a Giffen good
Q134: Economists Robert Jensen and Nolan Miller reasoned
Q135: A Giffen good could be either a
Unlock this Answer For Free Now!
View this answer and more for free by performing one of the following actions

Scan the QR code to install the App and get 2 free unlocks

Unlock quizzes for free by uploading documents