The graph below represents the market for walnuts.Identify the values of the marginal benefit and the marginal cost at the output levels of 2,000 pounds,4,000 pounds,and 6,000 pounds.At each of these output levels,state whether output is inefficiently high,inefficiently low,or economically efficient. 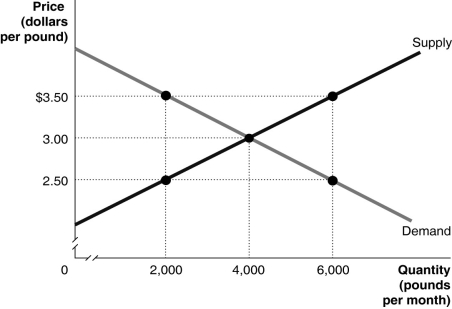
Correct Answer:
Verified
View Answer
Unlock this answer now
Get Access to more Verified Answers free of charge
Q82: If marginal benefit is less than marginal
Q88: Equilibrium in a competitive market results in
Q89: Economic efficiency is a market outcome in
Q109: Rent control is an example of
A)a subsidy
Q119: Which of the following is not a
Q196: Figure 4-7 Q197: Figure 4-7 Q201: Table 4-7 Q202: The graph below represents the market for Q204: Table 4-7 Unlock this Answer For Free Now! View this answer and more for free by performing one of the following actions Scan the QR code to install the App and get 2 free unlocks Unlock quizzes for free by uploading documents![]()
![]()
![]()
![]()

