The figure below shows the demand (D) and supply (S) curves of a good produced domestically in an economy as well as traded in the international market. Figure 35.1 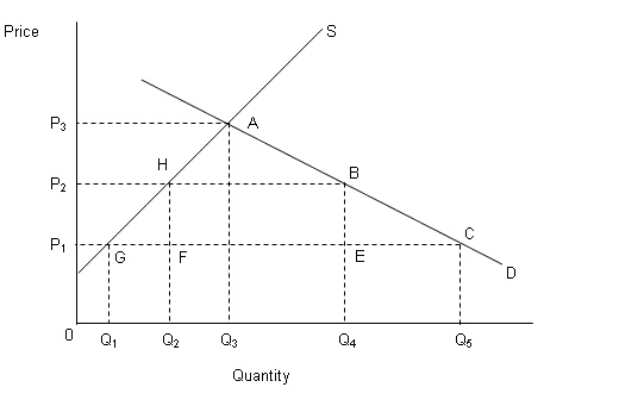 In the figure,
P1: Price of the good in the international market.
P2: Price of the good in the domestic market after the imposition of tariff by the government.
P3: No-trade price of the good in the domestic market.
According to Figure 35.1, if the international price of the good is P1, which of the following statements is true?
A) The domestic market is in equilibrium.
B) There is an excess supply in the domestic market by the amount Q4 - Q2.
C) The country will export Q3 - Q1 units of the good.
D) There is an excess demand of Q4 - Q2 units in the domestic market.
E) The country needs to import Q5 - Q1 units of the good to satisfy domestic demand.
Correct Answer:
Verified
Q1: Which of the following statements about international
Q1: The table below shows the quantity demanded
Q10: The table below shows the quantity demanded
Q16: Nascent industries require adequate protection from foreign
Q17: The table below shows the quantity demanded
Q23: The figure below shows the demand (D)
Q26: If average costs of production decline with
Q33: The table below shows the quantity demanded
Q35: One important unintended consequence of the Smoot-Hawley
Q38: The table below shows the quantity demanded
Unlock this Answer For Free Now!
View this answer and more for free by performing one of the following actions

Scan the QR code to install the App and get 2 free unlocks

Unlock quizzes for free by uploading documents