The figure below shows the demand (D) and supply (S) curves of cocoa in the U.S. Figure 35.4 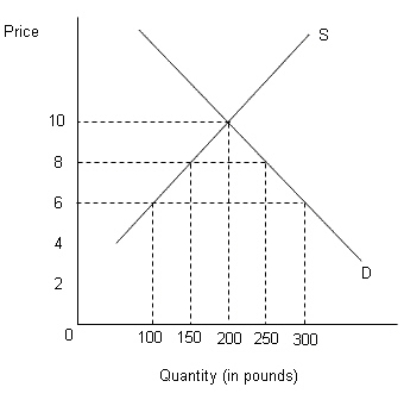 According to Figure 35.4, the no-trade equilibrium price and quantity of cocoa in the U.S.market are:
A) $8 and 150 pounds.
B) $10 and 250 pounds.
C) $4 and 200 pounds.
D) $10 and 200 pounds.
E) $6 and 300 pounds.
Correct Answer:
Verified
Q62: The figure below shows the demand (D)
Q63: As a result of the government procurement
Q63: The figure below shows the demand (D)
Q68: The figure below shows the demand (D)and
Q71: Trade diversion reduces worldwide efficiency,because:
A)production is diverted
Q75: Subsidies are payments made by the government
Q75: The figure below shows the demand (D)and
Q76: The figure below shows the demand (D)and
Q77: The figure below shows the demand (D)
Q78: The figure below shows the demand (D)
Unlock this Answer For Free Now!
View this answer and more for free by performing one of the following actions

Scan the QR code to install the App and get 2 free unlocks

Unlock quizzes for free by uploading documents