The figure given below shows the import demand and export supply curves of corn of the U.S.and Mexico. Figure 34.2 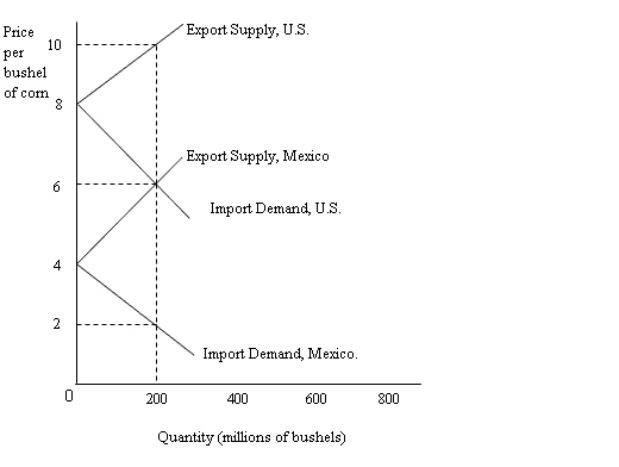 Refer to Figure 34.2.The no-trade equilibrium price of corn in the U.S.is:
A) $2.
B) $4.
C) $6.
D) $8.
E) $10.
Correct Answer:
Verified
Q61: The table below shows the quantity demanded
Q62: The table below shows the quantity demanded
Q66: The product life cycle theory predicts that
Q66: The table below shows the quantity demanded
Q66: The table below shows the quantity demanded
Q72: The figure given below shows the import
Q74: The figure given below shows the import
Q75: The table below shows the quantity demanded
Q76: Firms in industrial countries find a larger
Q80: The table below shows the quantity demanded
Unlock this Answer For Free Now!
View this answer and more for free by performing one of the following actions

Scan the QR code to install the App and get 2 free unlocks

Unlock quizzes for free by uploading documents