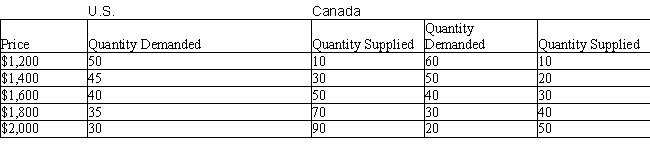
The table below shows the quantity demanded (in thousands) and quantity supplied (in thousands) of computers in the U.S. and Canada at different prices.Table 20.5
-The comparative advantage in a specific good can shift over time from one country to another, as the other countries can produce it at a cheaper cost after imitating the technology.
Correct Answer:
Verified
Q97: The table below shows the quantity demanded
Q98: The table below shows the quantity demanded
Q99: The table below shows the quantity demanded
Q100: The table below shows the quantity demanded
Q101: The table below shows the quantity demanded
Q103: The table below shows the quantity demanded
Q104: The table below shows the quantity demanded
Q105: The table below shows the quantity demanded
Q106: The table below shows the quantity demanded
Q107: The table below shows the quantity demanded
Unlock this Answer For Free Now!
View this answer and more for free by performing one of the following actions

Scan the QR code to install the App and get 2 free unlocks

Unlock quizzes for free by uploading documents