The table below shows the distribution of income in the U.S.in the year 1978. Table 33.1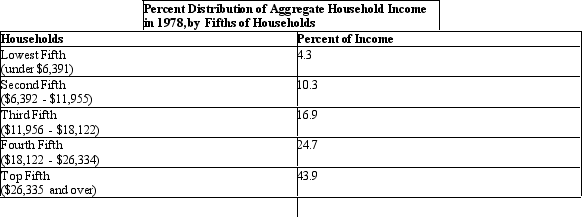 If a Lorenz curve is drawn using the data in Table 33.1, it will:
A) coincide with the line of perfect equality.
B) be a L-shaped curve.
C) bow above the line of perfect equality.
D) bow down below the line of perfect equality.
E) be a rectangular shaped curve.
Correct Answer:
Verified
Q3: The figure given below represents an imperfectly
Q3: In Country X,the highest 10 percent of
Q4: Empirical observations validate that the Gini co-efficient
Q5: The greater the value of the Gini
Q9: The table below shows the distribution of
Q11: If the Gini coefficient for the United
Q16: The figure given below represents an imperfectly
Q16: The diagram that represents how income is
Q17: Which of the following results from the
Q17: The figure given below represents an imperfectly
Unlock this Answer For Free Now!
View this answer and more for free by performing one of the following actions

Scan the QR code to install the App and get 2 free unlocks

Unlock quizzes for free by uploading documents