The figure given below shows the Lorenz curves of two countries (Country A and Country B) . Figure 33.2
Total income (cumulative percentage) 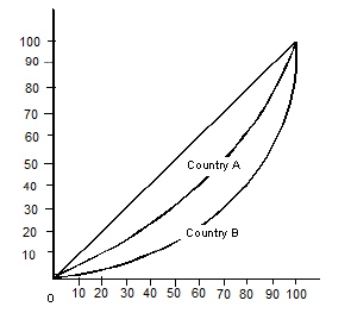 Total population (cumuative percentage)
In Figure 33.2, the richest 20 percent of the population in Country B receive:
A) 20 percent of the national income.
B) 60 percent of the national income.
C) 50 percent of the national income.
D) 40 percent of the national income.
E) 80 percent of the national income.
Correct Answer:
Verified
Q10: If 50 percent of the population receives
Q11: The figure given below represents an imperfectly
Q13: The figure given below represents an imperfectly
Q15: A Gini of 0 implies:
A)every family has
Q20: The table below shows the distribution of
Q22: The figure given below shows the Lorenz
Q27: According to the Bureau of Labor Statistics,the
Q32: The figure given below shows the Lorenz
Q34: The figure given below shows the Lorenz
Q36: The figure given below shows the Lorenz
Unlock this Answer For Free Now!
View this answer and more for free by performing one of the following actions

Scan the QR code to install the App and get 2 free unlocks

Unlock quizzes for free by uploading documents