The figure given below represents demand for and supply of hospital beds in Anytown, U.S.A. , as shown by curves D and S1 in the following figure.If the hospital receives permission to expand, its new supply curve will be S2.Price level P1 is the fixed prospective payment reimbursement rate paid by Medicare to the hospital, regardless of actual cost. Figure 32.3 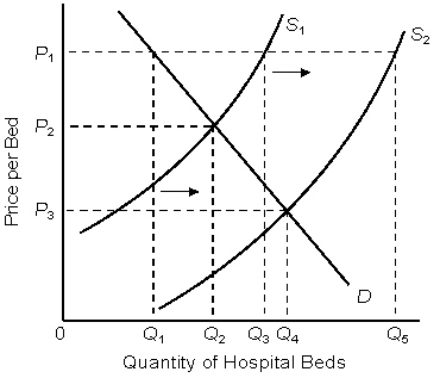 According to Figure 32.3, the surplus of beds caused by the fixed reimbursement rate, after the expansion of the hospital is the difference between _____ and _____.
A) Q5;Q1
B) Q5;Q2
C) Q4;Q2
D) Q3;Q2
E) Q3;Q1
Correct Answer:
Verified
Q22: Which of the following can increase the
Q26: The American Medical Association helps increase:
A)price competition
Q29: The figure given below shows the demand
Q30: The bulk of the cost of hospital
Q31: What is the effect of the aging
Q32: Which of the following statements about Medicare
Q34: The high cost of hospital care in
Q35: The figure given below represents demand for
Q37: Which of the following is a consequence
Q40: The American Medical Association's payment system is
Unlock this Answer For Free Now!
View this answer and more for free by performing one of the following actions

Scan the QR code to install the App and get 2 free unlocks

Unlock quizzes for free by uploading documents