The following figure shows the demand (D) and supply (S) curves of human organs Figure 32.5 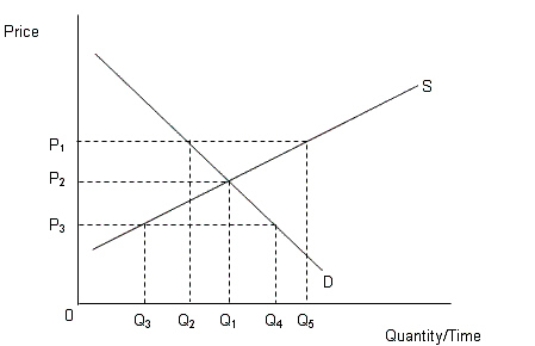 Which of the following factors might have led to a fall in the price of human organs from P2 to P3 in Figure 32.5?
A) A decline in supply of human organs in the black market
B) An increase in demand for human organs
C) Increased supply of alternatives to organs created by technological changes
D) A restriction imposed by the government on trading in human organs
E) Reduced motivation among the donors to donate their organs
Correct Answer:
Verified
Q28: The increase in physicians' fees in the
Q32: Which of the following statements about Medicare
Q41: Why are black markets for human organs
Q43: The figure given below represents demand for
Q43: A physician who prescribes unnecessary tests to
Q46: Which of the following facts is true
Q47: Why is health care considered to be
Q48: The figure below shows the demand (AD)and
Q50: People who oppose the establishment of an
Q54: Which of the following is true of
Unlock this Answer For Free Now!
View this answer and more for free by performing one of the following actions

Scan the QR code to install the App and get 2 free unlocks

Unlock quizzes for free by uploading documents