The figures given below show the demand (D) and supply (S) curves of labor in two different markets. Figure 29.3 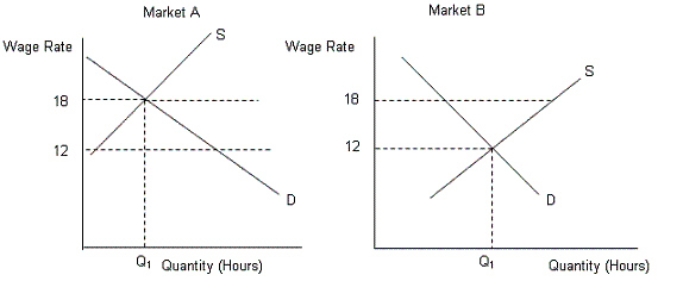 From Figure 29.3, calculate the amount of the wage differential.
A) $6
B) $18
C) $2
D) $20
E) $15
Correct Answer:
Verified
Q5: The figure below shows the supply curve
Q5: Which of the following is a reason
Q6: The figure below shows the supply curve
Q7: Which of the following statements contradicts the
Q8: The figure given below shows the demand
Q9: The labor demand curve is based on
Q11: It is said that a wage increase
Q12: Why does the labor market have more
Q16: Which of the following is a true
Q17: The term compensating wage differential refers to:
A)the
Unlock this Answer For Free Now!
View this answer and more for free by performing one of the following actions

Scan the QR code to install the App and get 2 free unlocks

Unlock quizzes for free by uploading documents