The following figures show the demand and supply of labor in two different types of labor market. Figure 29.5 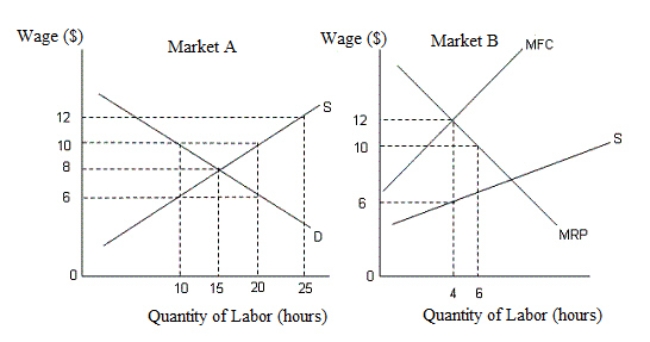 In the figures,
D: Demand curve for labor
S: Supply curve of labor
MRP: Marginal revenue product
MFC: Marginal factor cost
The Market A described in Figure 29.5 is a(n) :
A) monopsonist market.
B) monopolistic market.
C) perfectly competitive labor market.
D) monopolistically competitive market.
E) oligopolistic market.
Correct Answer:
Verified
Q1: Scenario 14.1
A worker in Firm A earns
Q18: The figure given below shows the demand
Q19: The figure given below shows the demand
Q20: As the wage rate increases,the quantity supplied
Q23: The intention of a minimum wage is
Q26: The U.S.government has time and again raised
Q26: According to Figure 29.4, one of the
Q33: Why are a large number of IT
Q36: The figures given below show the demand
Q39: The figures given below show the demand
Unlock this Answer For Free Now!
View this answer and more for free by performing one of the following actions

Scan the QR code to install the App and get 2 free unlocks

Unlock quizzes for free by uploading documents