The following figures show the demand and supply of labor in two different types of labor market. Figure 29.5 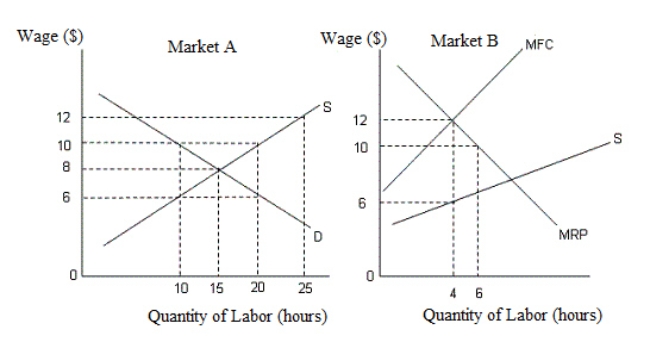 In the figures,
D: Demand curve for labor
S: Supply curve of labor
MRP: Marginal revenue product
MFC: Marginal factor cost
In Figure 29.5, the equilibrium wage rate and the level of employment in Market A are _____ and _____ respectively.
A) $8;15 hours.
B) $10;10 hours.
C) $10;20 hours.
D) $12;25 hours.
E) $6;20 hours.
Correct Answer:
Verified
Q27: Why has the inequality of income become
Q28: If the supply of skilled workers is
Q29: A college student's choice of a major
Q30: The figure given below shows the demand
Q30: An individual is induced to change his/her
Q32: Investment in human capital implies:
A)investment on machines,technological
Q36: The following figures show the demand and
Q37: Which of the following statements is true?
A)Income
Q38: Why do skilled workers earn relatively higher
Q38: The figure given below shows the demand
Unlock this Answer For Free Now!
View this answer and more for free by performing one of the following actions

Scan the QR code to install the App and get 2 free unlocks

Unlock quizzes for free by uploading documents