The figure given below represents equilibrium in the labor market. Figure 28.5 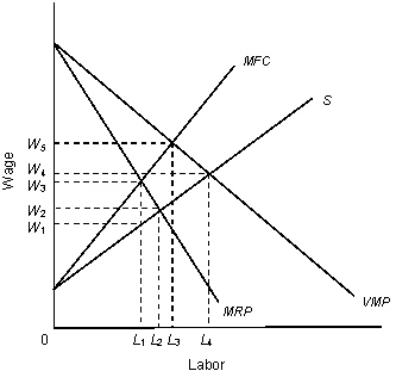 In the figure,
VMP: Value of marginal product curve
MRP: Marginal revenue product curve
MFC: Marginal factor cost
S: Supply curve of labor
In Figure 28.5, the firm is:
A) a monopsonist in the labor market and a perfect competitor in the output market.
B) a monopsonist in the labor market and a monopolist in the output market.
C) a perfect competitor in all markets.
D) a perfect competitor in the labor market and a monopolist in the output market.
E) either a monopolist or a monopsonist, but not both.
Correct Answer:
Verified
Q64: The figure given below represents equilibrium in
Q65: The figure given below represents equilibrium in
Q67: The figure given below represents equilibrium in
Q69: The figure given below represents equilibrium in
Q70: The figure given below represents equilibrium in
Q71: The figure given below represents equilibrium in
Q72: The figure given below represents equilibrium in
Q73: If an individual thinks about how he
Q79: The figure given below represents equilibrium in
Q80: The figure given below represents equilibrium in
Unlock this Answer For Free Now!
View this answer and more for free by performing one of the following actions

Scan the QR code to install the App and get 2 free unlocks

Unlock quizzes for free by uploading documents