In the following figure, the first panel shows a market situation prior to regulation and the second panel shows the effects of regulation. Figure 26.2 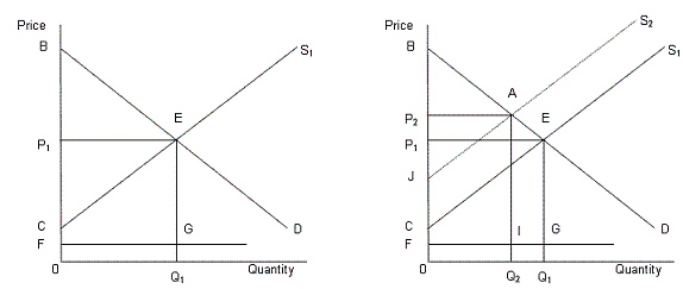 In the figure,
D: Demand curve for automobiles
S1: Supply curve of automobiles prior to regulation
S2: Supply curve of automobiles after regulation
FG: Clean up cost per unit
According to Figure 26.2, the total societal surplus after the regulation is:
A) area BEC.
B) area AECJ.
C) area IGQ1Q2.
D) area 0FIQ2.
E) area BAJ.
Correct Answer:
Verified
Q26: Which of the following was formed in
Q28: Q39: The figure below shows revenue and cost Q40: The figure below shows revenue and cost Q41: In the following figure, the first panel Q42: Graphically,consumer surplus is the area: Q48: Why was trucking deregulated in the U.S.in Q56: An example of the opportunity costs involved Q57: Cities and local governments in the United Q57: The figure below shows revenue and cost![]()
A)above the demand
Unlock this Answer For Free Now!
View this answer and more for free by performing one of the following actions

Scan the QR code to install the App and get 2 free unlocks

Unlock quizzes for free by uploading documents