The figure below shows the revenue and cost curves of a monopolistically competitive firm. Figure 25.2 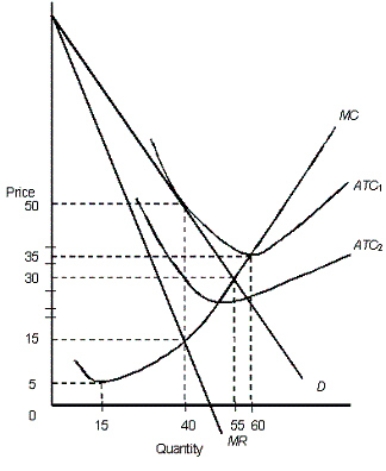 In the figure,
D: Demand curve
MR: Marginal revenue curve
ATC1 and ATC2: Average total cost curves
MC: Marginal cost curve
In Figure 25.2, if the market is monopolistically competitive, which quantity represents long-run equilibrium for the firm?
A) 15
B) Between 15 and 40
C) 40
D) 55
E) 60
Correct Answer:
Verified
Q1: The major similarity between a monopolist and
Q3: The figure given below shows the cost
Q4: When the existing firms in a monopolistically
Q5: Which of the following statements about the
Q6: The figure given below shows the cost
Q11: A monopolistically competitive firm's demand curve slopes
Q11: The figure given below shows the cost
Q12: In a certain monopolistically competitive market that
Q13: According to Figure 25.1, the profit-maximizing firm
Q14: Monopolistic competition is similar to perfect competition
Unlock this Answer For Free Now!
View this answer and more for free by performing one of the following actions

Scan the QR code to install the App and get 2 free unlocks

Unlock quizzes for free by uploading documents