The figure given below shows the revenue and cost curves of a monopolistically competitive firm. Figure 25.3 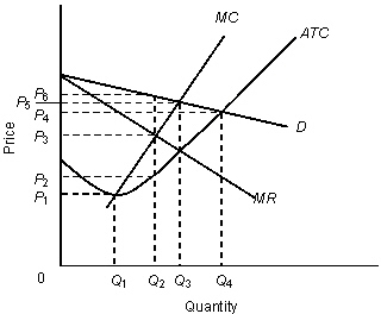 In the figure,
D: Demand curve
MR: Marginal revenue curve
MC: Marginal cost curve
ATC: Average total cost curve
The profit per unit of output for the firm in the Figure 25.3 is:
A) P5 - P3.
B) P6 - P3.
C) P3 - P2.
D) P6 - P2.
E) P4 - P2.
Correct Answer:
Verified
Q22: Advertising,brand names,packaging,and celebrity endorsements all occur in
Q22: The figure given below shows the revenue
Q23: The figure given below shows the revenue
Q26: The figure below shows the revenue and
Q27: The figure given below shows the revenue
Q28: The figure given below shows the revenue
Q33: The figure given below shows the revenue
Q42: The oligopoly market structure model is characterized
Q56: The figure given below shows the revenue
Q58: Martin is in the market for a
Unlock this Answer For Free Now!
View this answer and more for free by performing one of the following actions

Scan the QR code to install the App and get 2 free unlocks

Unlock quizzes for free by uploading documents