The following figure shows the revenue curves of a monopolist: Figure 24.6 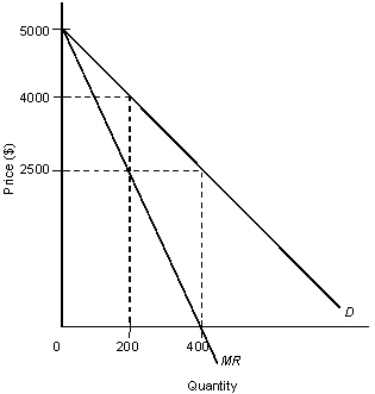 D: Average revenue
MR: Marginal revenue
In Figure 24.6, assume that marginal costs are constant at $2, 500 and fixed costs are 0.What would be the amount of consumer surplus if the market was perfectly competitive?
A) $1, 000, 000
B) $500, 000
C) $300, 000
D) $250, 000
Correct Answer:
Verified
Q64: The following figure shows revenue and cost
Q65: The following figure shows the revenue curves
Q68: The figure given below shows the demand
Q68: The figure given below shows the demand
Q70: The efficiency loss that occurs when a
Q70: The following figures show the demand and
Q71: The figure below shows the market equilibrium
Q73: Compared with a perfectly competitive market with
Q73: The following figure shows the revenue curves
Q74: The figure given below shows the demand
Unlock this Answer For Free Now!
View this answer and more for free by performing one of the following actions

Scan the QR code to install the App and get 2 free unlocks

Unlock quizzes for free by uploading documents