The following figures show the demand and cost curves of a perfectly competitive and a monopoly firm respectively. Figure 24.7 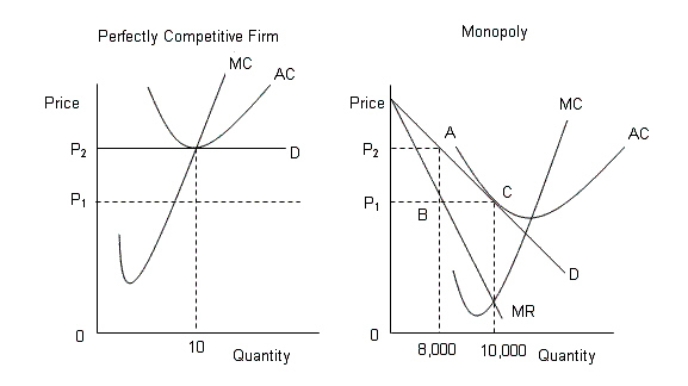 D: Average Revenue
AC: Average cost
MC: Marginal cost
MR: Marginal cost
Refer to Figure 24.7.If the perfectly competitive industry and the monopoly produces the same quantity, then:
A) there are 10 firms in the perfectly competitive industry.
B) there are 800 firms in the perfectly competitive industry.
C) there are 1, 000 firms in the perfectly competitive industry.
D) there are 2, 000 firms in the perfectly competitive industry.
E) there are 100 firms in the perfectly competitive industry.
Correct Answer:
Verified
Q49: The table given below shows the price,
Q55: The table given below shows the price,
Q58: The following table shows the marginal revenues
Q59: The following figure shows the revenue and
Q62: The following figure shows revenue and cost
Q64: The following figure shows revenue and cost
Q65: The following figure shows the revenue curves
Q68: The figure given below shows the demand
Q69: The following table shows the marginal revenues
Q98: Why does a efficiency loss arise under
Unlock this Answer For Free Now!
View this answer and more for free by performing one of the following actions

Scan the QR code to install the App and get 2 free unlocks

Unlock quizzes for free by uploading documents