The following figures show the demand and cost curves of a perfectly competitive and a monopoly firm respectively. Figure 24.7 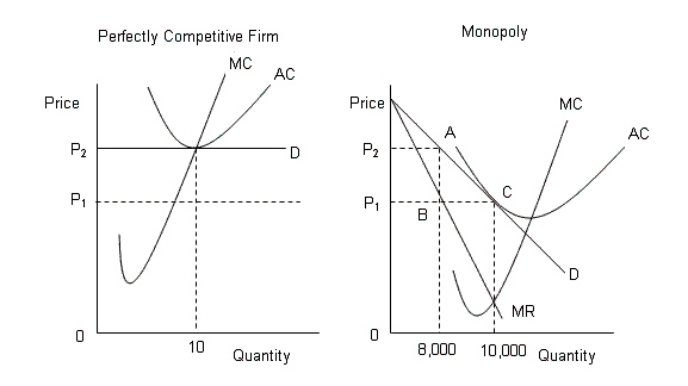 D: Average Revenue
AC: Average cost
MC: Marginal cost
MR: Marginal cost
According to Figure 24.7, which of the following statements is incorrect about the price P1?
A) The monopolist is maximizing profit at P1.
B) In the long run, firms will leave the perfectly competitive industry and force the price upward.
C) The monopolist is earning normal profit at P1.
D) Both the firms maximize their profits at P1 .
E) The perfectly competitive firm would produce 10 units of output at P1.
Correct Answer:
Verified
Q65: The following figure shows the revenue curves
Q68: The figure given below shows the demand
Q68: The figure given below shows the demand
Q69: The following figure shows the revenue curves
Q70: The efficiency loss that occurs when a
Q71: The figure below shows the market equilibrium
Q73: Compared with a perfectly competitive market with
Q73: The following figure shows the revenue curves
Q74: The figure given below shows the demand
Q74: The figure given below shows the demand
Unlock this Answer For Free Now!
View this answer and more for free by performing one of the following actions

Scan the QR code to install the App and get 2 free unlocks

Unlock quizzes for free by uploading documents