The following figure shows revenue and cost curves of a monopolist. Figure 24.8 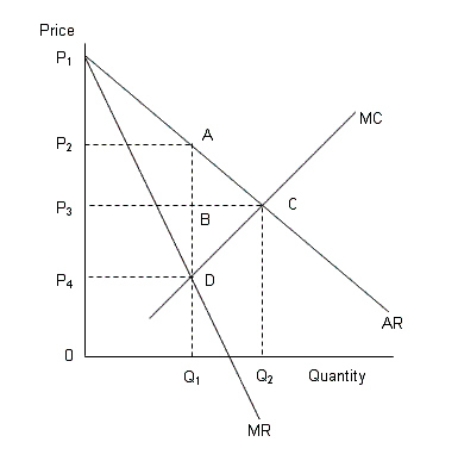 AR: Average revenue curve
MR: Marginal revenue curve
MC: Marginal cost curve
According to Figure 24.7, the deadweight loss of monopoly is:
A) the area ABC.
B) the area BCD.
C) the area ACD.
D) the area P3P2AC.
E) the area P3P4DC.
Correct Answer:
Verified
Q81: The figure given below shows the cost
Q88: The figure given below shows the cost
Q90: The figure given below shows the cost
Q96: The figure given below shows the cost
Q97: The marginal revenue curve of a monopolist
Q100: The table given below shows the price,
Q104: The figure given below shows the cost
Q109: The figure given below shows the cost
Q114: The figure given below shows the cost
Q118: The figure given below shows the cost
Unlock this Answer For Free Now!
View this answer and more for free by performing one of the following actions

Scan the QR code to install the App and get 2 free unlocks

Unlock quizzes for free by uploading documents