The figure given below shows the revenue and cost curves of a perfectly competitive firm. Figure 23.2 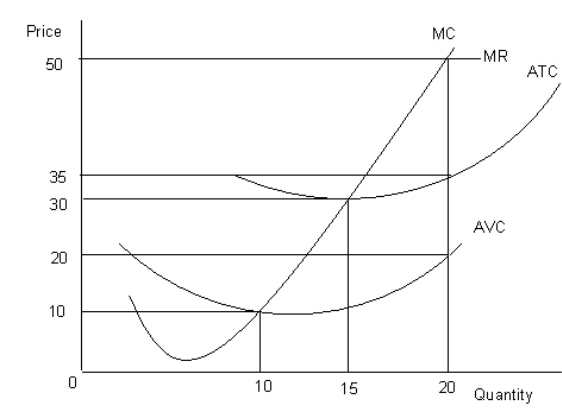 MC: Marginal cost curve
MR: Marginal revenue curve
ATC: Average-total-cost curve
AVC: Average-variable-cost curve
Refer to Figure 23.2.What is the firm's total fixed cost at the profit-maximizing output level?
A) $400
B) $300
C) $600
D) $450
E) $500
Correct Answer:
Verified
Q24: To maximize profits in the short run,a
Q27: If in the short run,at the profit
Q37: The table given below shows the total
Q38: The figure given below shows the revenue
Q41: The figure given below shows the revenue
Q46: The figure given below shows the revenue
Q48: The figure given below shows the revenue
Q50: If the marginal cost exceeds the marginal
Q59: At an output level above the profit-maximizing
Q72: The figure given below shows the revenue
Unlock this Answer For Free Now!
View this answer and more for free by performing one of the following actions

Scan the QR code to install the App and get 2 free unlocks

Unlock quizzes for free by uploading documents