The figure given below shows the revenue and cost curves of a perfectly competitive firm. Figure 23.5 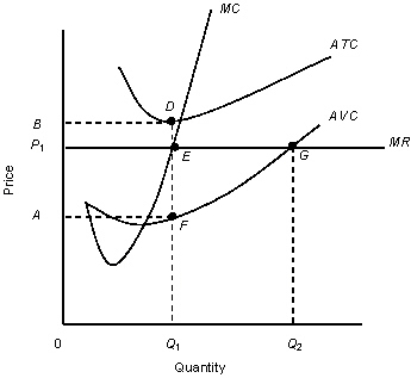 MC: Marginal cost curve
MR: Marginal revenue curve.
ATC: Average-total-cost curve
AVC: Average-variable-cost curve
According to Figure 23.5, the firm has:
A) profits equal to the area AP1EF.
B) profits equal to the area P1BDE.
C) losses equal to the area 0AFQ1.
D) losses equal to the area P1BDE.
E) no profit no loss.
Correct Answer:
Verified
Q74: The figure given below shows the revenue
Q75: The figure given below shows the demand
Q76: Since the beginning of the millennium,the United
Q78: The figure given below shows the revenue
Q79: In the short run a competitive firm
Q80: The figure given below shows the demand
Q83: The following figure shows equilibrium at the
Q84: The figure given below shows the revenue
Q95: The figure given below shows the revenue
Q97: The following figure shows equilibrium at the
Unlock this Answer For Free Now!
View this answer and more for free by performing one of the following actions

Scan the QR code to install the App and get 2 free unlocks

Unlock quizzes for free by uploading documents