The figure given below shows the cost curves of a firm. Figure 22.3 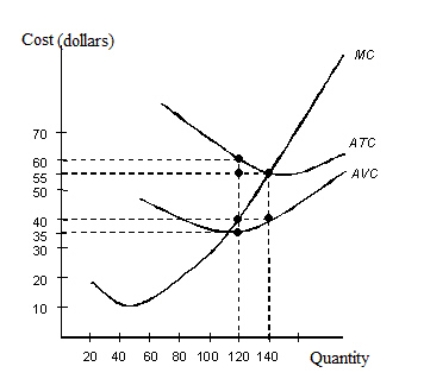 ATC: Average Total Cost
AVC: Average Variable Cost
MC: Marginal Cost
In Figure 22.3, if the marginal revenue of the firm is constant at $55, calculate the profit earned by the firm?
A) $35
B) $40
C) $600
D) $4, 800
E) $0
Correct Answer:
Verified
Q52: Which of the following is not true
Q53: A(n) _ is a price taker.
A)monopolistic firm.
B)oligopoly
Q55: If barriers to entry exist in a
Q55: The figure given below shows the revenue
Q56: Why does a monopolist face the market
Q62: A monopolistically competitive firm faces a relatively
Q65: Scenario 22.1 Jane left her job at
Q75: The figure given below shows the revenue
Q79: The figure given below shows the revenue
Q80: Steve is about to start up a
Unlock this Answer For Free Now!
View this answer and more for free by performing one of the following actions

Scan the QR code to install the App and get 2 free unlocks

Unlock quizzes for free by uploading documents