The figure below shows the demand (D) and supply (S) curves of a good produced domestically in an economy as well as traded in the international market. Figure 21.1 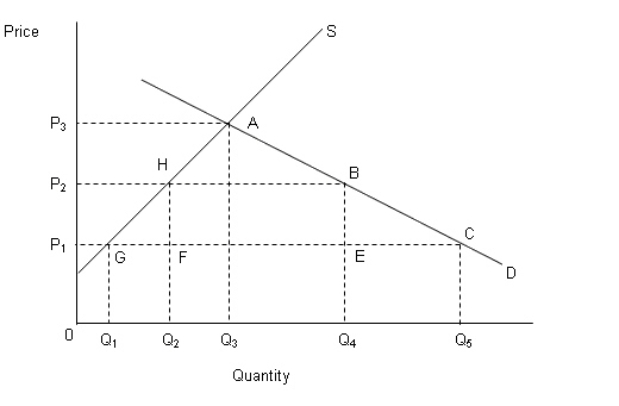 In the figure,
P1: Price of the good in the international market.
P2: Price of the good in the domestic market after the imposition of tariff by the government.
P3: No-trade price of the good in the domestic market.
According to Figure 21.1, the tariff revenue earned by the domestic government is equal to the:
A) area ABEFH.
B) area FEQ4Q2.
C) area ABH.
D) area HFP1P2.
E) area BEFH
Correct Answer:
Verified
Q24: The table below shows the quantity demanded
Q26: If average costs of production decline with
Q27: The figure below shows the demand (D)
Q28: Suppose the production of helicopters is an
Q30: The table below shows the quantity demanded
Q36: According to strategic trade policy,international trade largely
Q38: The table below shows the quantity demanded
Q42: The figure given below depicts the negatively
Q43: The figure given below depicts the negatively
Q56: Which of the following countries is forbidden
Unlock this Answer For Free Now!
View this answer and more for free by performing one of the following actions

Scan the QR code to install the App and get 2 free unlocks

Unlock quizzes for free by uploading documents