The figure given below depicts the negatively sloped demand and positively sloped supply curves of wheat in a country. Figure 21.2 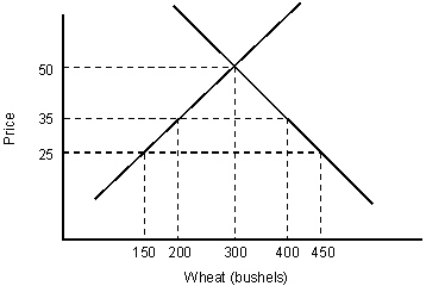 According to Figure 21.2, if the world price per bushel of wheat is $25, what is the domestic production?
A) 300 bushels
B) 450 bushels
C) 400 bushels
D) 150 bushels
E) 200 bushels
Correct Answer:
Verified
Q43: The figure given below depicts the negatively
Q44: The figure given below depicts the negatively
Q45: The figure given below depicts the negatively
Q46: The figure given below depicts the negatively
Q47: The figure below shows the demand (D)and
Q49: By restricting the amount of a good
Q51: The figure below shows the demand (D)and
Q52: The figure given below depicts the negatively
Q53: The figure below shows the demand (D)and
Q56: The figure below shows the demand (D)
Unlock this Answer For Free Now!
View this answer and more for free by performing one of the following actions

Scan the QR code to install the App and get 2 free unlocks

Unlock quizzes for free by uploading documents