The figure below shows the demand (D) and supply (S) curves of corn syrups. Figure 21.3 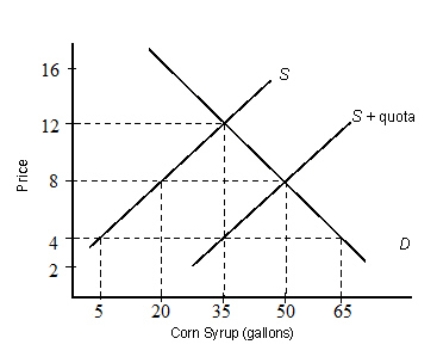 In Figure 21.3, with an import quota of 30 gallons of corn syrup, what is the new equilibrium quantity demanded?
A) 35 gallons
B) 50 gallons
C) 20 gallons
D) 65 gallons
E) 5 gallons
Correct Answer:
Verified
Q45: Suppose that the world price of kiwi
Q52: The figure given below depicts the negatively
Q53: The figure below shows the demand (D)and
Q54: The figure below shows the demand (D)and
Q55: The figure given below depicts the negatively
Q56: The figure given below depicts the negatively
Q58: The figure given below depicts the negatively
Q60: The figure given below depicts the negatively
Q68: The most successful free trade agreements achieve
Q75: Subsidies are payments made by the government
Unlock this Answer For Free Now!
View this answer and more for free by performing one of the following actions

Scan the QR code to install the App and get 2 free unlocks

Unlock quizzes for free by uploading documents