The figure below shows the demand (D) and supply (S) curves of cocoa in the U.S. Figure 21.4 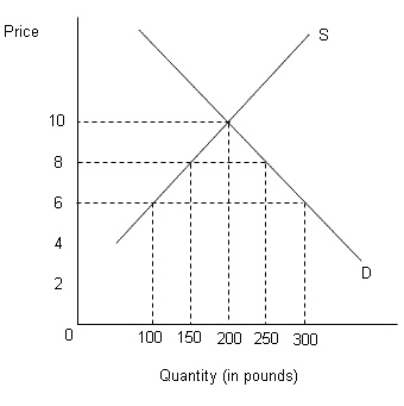 According to Figure 21.4, the no-trade equilibrium price and quantity of cocoa in the U.S.market are:
A) $8 and 150 pounds.
B) $10 and 250 pounds.
C) $4 and 200 pounds.
D) $10 and 200 pounds.
E) $6 and 300 pounds.
Correct Answer:
Verified
Q62: The figure below shows the demand (D)
Q63: The figure below shows the demand (D)
Q64: One of the negative impacts of export
Q69: The figure below shows the demand (D)and
Q71: Trade diversion reduces worldwide efficiency,because:
A)production is diverted
Q74: The basic difference between a tariff and
Q76: The figure below shows the demand (D)
Q76: The figure below shows the demand (D)and
Q78: A customs union is an organization of
Q79: The figure below shows the demand (D)and
Unlock this Answer For Free Now!
View this answer and more for free by performing one of the following actions

Scan the QR code to install the App and get 2 free unlocks

Unlock quizzes for free by uploading documents