The figure given below depicts the foreign exchange market for British pounds traded for U.S.dollars. Figure 21.2 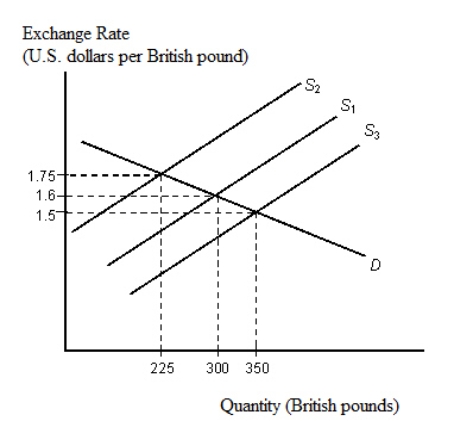 Refer to Figure 21.2.Suppose that the British central bank wishes to maintain a fixed exchange rate of £1 = $1.60.If supply decreases from S1 to S2, the bank must:
A) buy 25 pounds to shift the supply curve from S2 to S1.
B) buy 50 pounds to shift the supply curve from S2 to S1.
C) sell 75 pounds to shift the supply curve from S2 to S1.
D) buy 75 pounds to shift the supply curve from S2 to S1.
E) sell 10 pounds to shift the supply curve from S2 to S1.
Correct Answer:
Verified
Q44: The figure given below depicts the foreign
Q46: The figure given below depicts the foreign
Q47: The figure given below depicts the demand
Q55: The figure given below depicts the foreign
Q57: The figure given below depicts the foreign
Q58: The figure given below depicts the demand
Q68: The figure given below depicts the foreign
Q75: The figure given below depicts the foreign
Q75: Deviations from purchasing power parity will be
Q77: The figure given below depicts the foreign
Unlock this Answer For Free Now!
View this answer and more for free by performing one of the following actions

Scan the QR code to install the App and get 2 free unlocks

Unlock quizzes for free by uploading documents