The figure given below shows the import demand and export supply curves of corn of the U.S.and Mexico. Figure 20.2 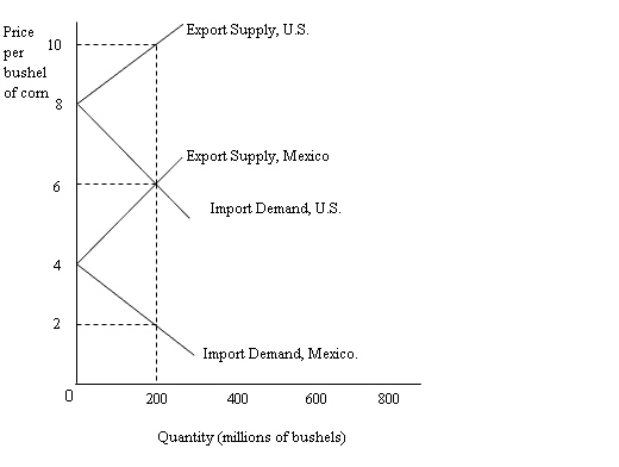 According to Figure 20.2, the international equilibrium price of corn is:
A) $2.
B) $4.
C) $6.
D) $8.
E) $10.
Correct Answer:
Verified
Q61: The table below shows the quantity demanded
Q63: The fact that the United States exports
Q71: The table below shows the quantity demanded
Q76: Firms in industrial countries find a larger
Q76: The table below shows the quantity demanded
Q76: The figure given below shows the import
Q78: The figure given below shows the import
Q78: Differences in the productivity of labor account
Q80: The table below shows the quantity demanded
Q80: According to the Ricardian model,the source of
Unlock this Answer For Free Now!
View this answer and more for free by performing one of the following actions

Scan the QR code to install the App and get 2 free unlocks

Unlock quizzes for free by uploading documents