The figure below shows the demand (D) and supply (S) curves of a good produced domestically in an economy as well as traded in the international market. Figure 20.1 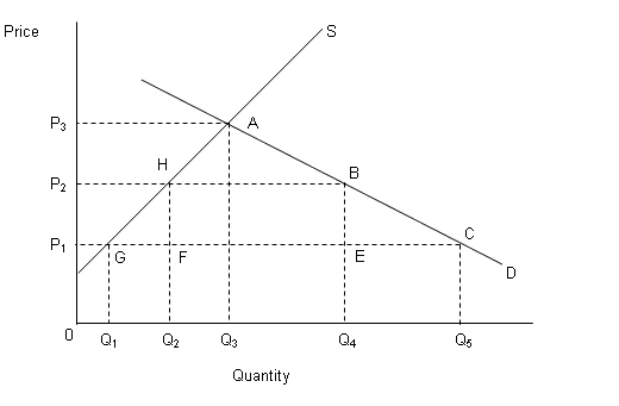 In the figure,
P1: Price of the good in the international market.
P2: Price of the good in the domestic market after the imposition of tariff by the government.
P3: No-trade price of the good in the domestic market.
Refer to Figure 20.1.If the government imposes a tariff such that the price of the good in the domestic market is P2 while the international price is P1, the dollar value of the tariff is equal to:
A) P3 - P1.
B) P2 - P3.
C) P2 - P1.
D) P1 - P2.
E) P1 - P3.
Correct Answer:
Verified
Q5: The table below shows the quantity demanded
Q6: Which of the following probably best explains
Q22: The figure below shows the demand (D)and
Q23: The figure below shows the demand (D)
Q24: The table below shows the quantity demanded
Q26: The figure below shows the demand (D)and
Q27: The figure below shows the demand (D)
Q28: The figure below shows the demand (D)and
Q35: One important unintended consequence of the Smoot-Hawley
Q36: According to strategic trade policy,international trade largely
Unlock this Answer For Free Now!
View this answer and more for free by performing one of the following actions

Scan the QR code to install the App and get 2 free unlocks

Unlock quizzes for free by uploading documents