The figure below shows the demand (D) and supply (S) curves of cocoa in the U.S. Figure 20.4 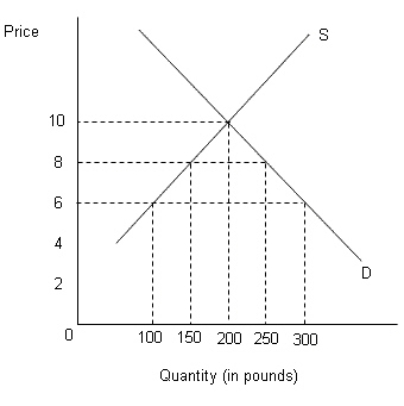 According to Figure 20.4, the no-trade equilibrium price and quantity of cocoa in the U.S.market are:
A) $8 and 150 pounds.
B) $10 and 250 pounds.
C) $4 and 200 pounds.
D) $10 and 200 pounds.
E) $6 and 300 pounds.
Correct Answer:
Verified
Q45: Suppose that the world price of kiwi
Q60: The figure given below depicts the negatively
Q62: The figure below shows the demand (D)
Q63: The figure below shows the demand (D)
Q63: As a result of the government procurement
Q65: The figure below shows the demand (D)and
Q66: Suppose,in the United States,each farmer is given
Q68: The figure below shows the demand (D)and
Q74: The basic difference between a tariff and
Q79: In 1992 the EEC was replaced by
Unlock this Answer For Free Now!
View this answer and more for free by performing one of the following actions

Scan the QR code to install the App and get 2 free unlocks

Unlock quizzes for free by uploading documents