The figure below shows the demand (D) and supply (S) curves of cocoa in the U.S. Figure 20.4 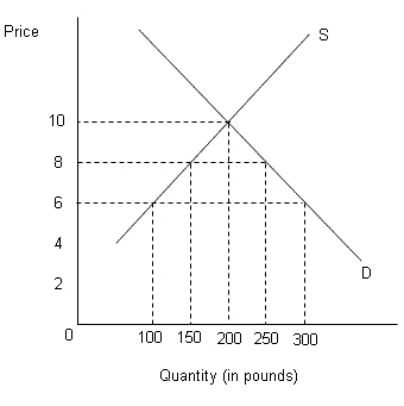 Refer to Figure 20.4.If cocoa sells for $6 per pound in the world market, determine the volume of U.S.cocoa imports.
A) 250 pounds
B) 350 pounds
C) 300 pounds
D) 150 pounds
E) 200 pounds
Correct Answer:
Verified
Q62: The figure below shows the demand (D)
Q64: The figure below shows the demand (D)and
Q65: The figure below shows the demand (D)and
Q66: Suppose,in the United States,each farmer is given
Q71: Trade diversion reduces worldwide efficiency,because:
A)production is diverted
Q74: The basic difference between a tariff and
Q76: The figure below shows the demand (D)
Q77: The figure below shows the demand (D)
Q78: A customs union is an organization of
Q79: In 1992 the EEC was replaced by
Unlock this Answer For Free Now!
View this answer and more for free by performing one of the following actions

Scan the QR code to install the App and get 2 free unlocks

Unlock quizzes for free by uploading documents